Send
Close Add comments:
(status displays here)
Got it! This site "robinsnyder.com" uses cookies. You consent to this by clicking on "Got it!" or by continuing to use this website. Note: This appears on each machine/browser from which this site is accessed.
Simple linear relationships
1. Simple linear relationships
The simplest relationship between an independent variable and a dependent variable is a linear relationship.
Many data relationships can be adequately described as a linear relationship.
2. Nonlinear relationships
A linear relationship is a relationship that can be modeled as a straight line.
Many data relationships are not linear and are called nonlinear.
Sometimes nonlinear relationships can be approximated by linear relationships - especially if the range of deviation is small.
Issues arise much more with extrapolation rather than with interpolation.
3. Straight lines
A straight line has the following form.
y = f(x) = m * x + b
m is the slope
b is the y-intercept
x is the independent variable
y is the dependent variable
For more information on lines, see
Linear equations .
4. Independent variables
An independent variable is assumed not to depend on anything else of concern to the problem. A dependent variable is assumed to depend on the independent variable and, perhaps, other dependent variables.
5. TV price problem
For example purposes, the following data represent the picture size, in inches, measured diagonally, of TV screens for sale at a retail outlet and the price of that TV.
Size Price
13 169
13 178
13 139
19 199
19 188
19 238
20 278
20 219
25 347
25 299
25 299
27 467
27 498
27 598
31 697
32 699
32 1099
50 1999
6. Questions
Is there a relationship between TV size and TV price?
If so, what is the nature of that relationship?
Can the relationship be modeled with a straight line?
7. Data
In order to do predictions, and as a first approximation, the data can be analyzed using linear regression.
The size is the independent data value (i.e., xi).
The price is the dependent data value (i.e., yi).
The regression is done on the dependent variable y
i and independent variable x
i.
8. Plot the data
The next step is to plot the data.
What type of chart is appropriate?
9. Charts
There are (at least) two reasons why a line chart is not appropriate.
First, a line chart has equally spaced horizontal increments, and the independent variable does not have equally spaced increments.
Second, a line chart permits only one dependent value to be plotted for each independent value, and there are several independent values that are the same.
List two reasons why a line chart is not appropriate for plotting regression data.
Why is a scatter plot more appropriate than a line graph for displaying dependent versus independent variables?
10. Scatter chart
A scatter chart is appropriate and might appear as follows.
A scatter chart is a way to visually depict the relationship between two variables.
Below is a Lua program for a scatter plot for this data.
Here is the Python code [#1]
Here is the output of the Python code.
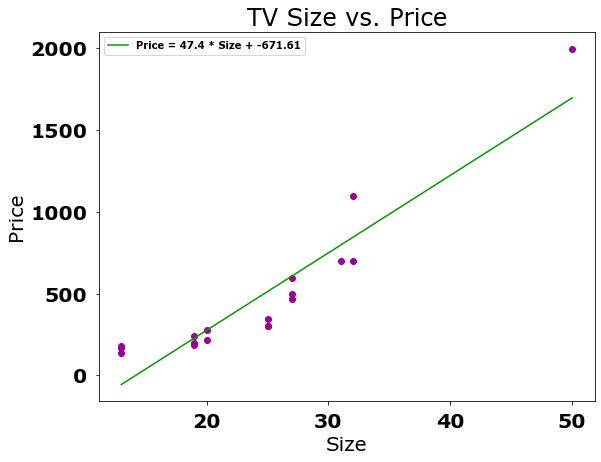
Notice that the intercept is negative! This is a nonlinear feature of the model for this data.
11. Regression chart
Here is the regression chart.

12. Legend
Note that since there is only one dependent variable, and since a legend would repeat information on the vertical axis, a legend is not needed.
13. Curve fitting
Fitting a straight line to a set of data is often called curve fitting, and the best curve is a straight line, since linear relationships are easy to work with quantitatively.
Unfortunately, most relationships in the real world are nonlinear in nature.
14. Regression equation
A regression equation is an equation that defines the relationship between independent and dependent variables.
Many regressions can be approximated, at least initially, with straight lines.
15. Least squares
In determining a regression equation for a linear relationship, the least squares principle minimizes the sum of the squared error (i.e., the difference between the actual and predicted y values).
A qualitative least squares method would determine a best fit of a line to data points by plotting the points by hand and drawing a line that seems to best fit the data.
That is, approximating a line through the data points that appears to minimize the error.
Quantitatively, the regression line should minimize the square of the error, where the error is the distance from the actual (measured) value to the predicted (model) value.
Why is the error squared?
16. Squared error
The error is squared to make all errors positive and to weight larger errors more than smaller errors.
What are the two primary reasons for squaring the error terms in a regression model?
17. Regression to the mean
The term regression comes from the fact that the data values tend towards, or regress to, the mean.
If
n data points (x
i, y
i) are collected, then a linear regression model will attempt to find slope
m and intercept
b such that the (linear) equation
yi = m xi + b
minimizes the sum of the squares of the errors.
18. End of page